Introducing PLASM - PLot Analysis Spreads for Meetings
Open-sourcing a fun little tool that might make your research meetings a bit more productive.
The problem
You’ve put together some nice data, made a histogram, and are showing it to your collaborators. Immediately, they want to see a log-scaled $y$-axis. But you didn’t prepare it, your plots aren’t interactive and the data are slow to reload, and time is running out in the meeting.
Now you have to promise to send the revised plot after the meeting. The research feedback loop has slowed.
The solution - PLASM
PLASM consists of two Python functions that make a spread of plots:
SPASM- ScatterPlot Analysis Spread for MeetingsCHASM- Cdf and Histogram Analysis Spread for Meetings
With a quick function call 1 you get all the combinations of log and linear scales that you could want, as well as some basic summary statistics. Now when you’re asked for a different scaling, just pull up the saved spread.
Examples
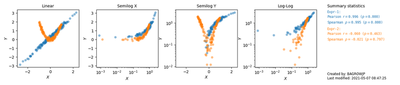
SPASM
Suppose we conducted two experiments, measuring for each an $x$ and $y$ variable. Let’s set of a plot spread comparing their scatter plots:
spasm(X1,Y1, X2,Y2, names=['Expr-1', 'Expr-2'])
CHASM
And here’s an example of chasm comparing the distributions of three variables:
chasm(D1,D2,D3, names=[f'data{i}' for i in range(3)], show_median=True)
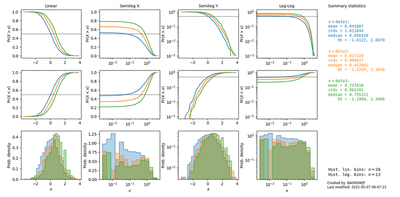
The top two rows are cumulative distributions (ECDFs) and the bottom row is histograms 2.
Redundancy. One thing to keep in mind with these spreads is that there’s a lot of redundancy. You’re plotting the same thing over and over, with different combinations of scales. That redundancy is by design. With a spread you can:
- see all the different scales, to help guide you to which is most informative (if you don’t have an educated guess in advance),
- save the plot figure as a file for reference to show during meetings.
This plot redundancy makes the spread less useful for, say, a final figure in a publication. In that case, you should already have a good handle on the best plot scale to use before you finish the paper figure. PLASM is best as a working tool.
Interested? You’re one pip install plasm away from plot spread goodness!
Be sure to check out the GitHub for more (especially the FAQ).
-
My design goal for PLASM is as little extra code and changes to how you work as possible. ↩︎
-
Histograms require choosing bins, and right now CHASM only has a basic auto binning procedure for the linear and logarithmic $x$-axis. More should be done. Of course, the CDF, computed properly, needs no binning 😂. ↩︎
Jim Bagrow
Associate Professor of Mathematics & Statistics
My research interests include complex networks, computational social science, and data science.